
A slow WordPress page needs a diagnosis before another optimization plugin. First identify the wait: does the browser spend time getting the initial response, downloading large resources, or trying to make the page respond after it appears? More than one problem can occur on the same page.
The original Systm Web article from January 2019 focused on hosting, oversized images and plugins. Those remain useful investigation areas, but neither a hosting price nor a plugin count identifies the cause by itself. This is newly written independent guidance, not a claim that the present publication performed the former business’s client work.
Make the complaint reproducible
Choose a specific page and task. “The product page takes a long time before I can choose a size on my phone” is a better starting point than “the website is slow.” Record the URL, device, browser, connection, whether you are logged in and what action you attempted.
Use a representative article, category and any important interactive page. A cached homepage does not stand in for an authenticated dashboard or checkout. Repeat a small set of checks under the same conditions and keep the individual results. One unusually fast run is a poor basis for a before-and-after claim.
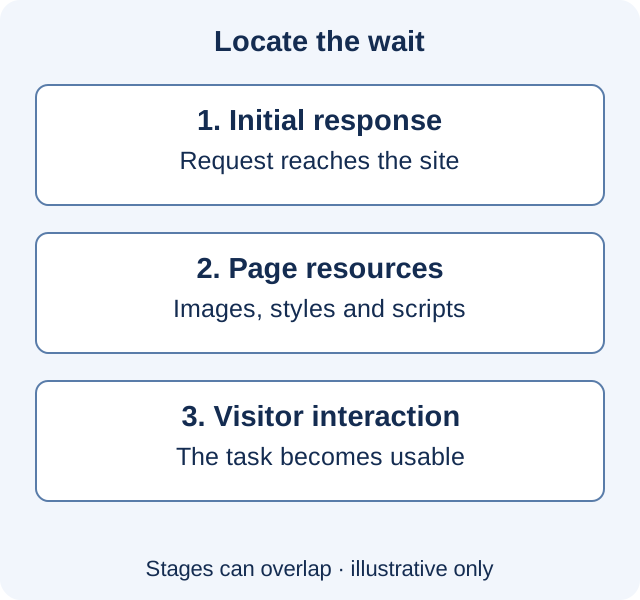
Find where the time goes
In Chrome, open DevTools, choose Network and reload the page. Inspect the main document and the large or long-running requests. The official Network reference explains the waterfall and request timing information. A long wait for the first response and a long download are different observations.
Record whether the browser cache is enabled. DevTools’ Disable cache option changes browser caching while the tools are open; it does not switch off a host’s page cache or a CDN. Keep those layers distinct when interpreting the result. Do not share an exported request log publicly without checking it for cookies, tokens or private URLs.
If the initial response is the delay, ask the host or developer to compare relevant server logs and resource usage at the same time. If the response is quick but the page remains awkward to use, look at what happens afterward. The WordPress optimization handbook describes hosting, configuration, caching and resource size as separate performance factors.
Inspect the image the visitor actually downloads
A small-looking picture can still be a large download. Find its request, then compare the delivered file with the space it occupies in the layout. Check the version selected on a narrow screen as well as on a desktop. Compressing a file that the page never uses will not change the visitor’s experience.
Keep an original image separately and test a suitably sized, compressed derivative. Judge the result at its displayed size: text in a diagram, product detail and photographs have different tolerances. A universal kilobyte target or quality setting can destroy useful detail without addressing the main delay.
Loading order matters too. Google’s image-performance guide explains why lazy loading can help images outside the initial view but delay an important image near the top. Check the actual main image rather than adding the same loading behavior to every image.
Test the suspect, not the plugin total
Use a safe test copy for changes that could interrupt the site’s work. Pick a suspected component because of a repeatable observation: a particular script, a slow request, a recent change or an error. Record the behavior with and without that component under the same conditions.
A plugin can be necessary and expensive in one part of the site while having little effect elsewhere. Removing several components simultaneously makes it harder to explain which change mattered. It may also remove the feature you were supposed to preserve. Keep the functional check beside the timing check.
A small investigation log beats a dramatic score
| Hypothetical observation | Next controlled check | What it would not prove |
|---|---|---|
| The hero image is a large download | Serve a smaller suitable derivative and compare the same page | That the server is now fast |
| The document response is slow on repeated uncached visits | Correlate the timing with server activity and application work | That every shared host is unsuitable |
| The page appears but a menu reacts late | Investigate the interaction and related scripts | That image compression will fix the menu |
| A score improves after removing a feature | Retest the task that feature supported | That the site is better for its visitors |
These are illustrative cases, not results from a SystmWeb test. Use them to separate an observation from the explanation you still need to verify. If two changes are required, record each change and its practical effect instead of assigning the whole improvement to the last one made.
Keep the improvement and its conditions
After a change, repeat the original task on the affected page and check a related page for regressions. Record the testing conditions, what improved and what remains uncertain. If a fresh page works but an old cached response does not, investigate the cache state before declaring the fix absent or complete.
Finish by adding the relevant behavior to your maintenance checks. A useful outcome is a faster, working task with a traceable change—not a target score achieved by removing the reason people visit.
Historical source context: archived Systm Web page 1 · archived Systm Web page 2. Technical references above were checked on November 16, 2026. Illustrative scenarios are not reports of client work.